This project has moved to:
- Our website https://castle-engine.io/
- GitHub repo: https://github.com/castle-engine/castle-engine/
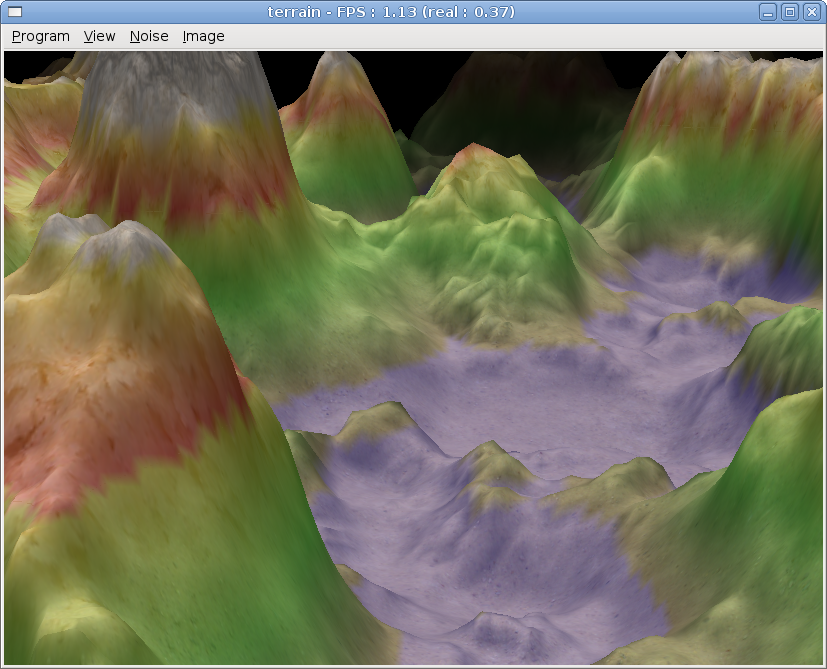
Cross-platform 3D and 2D game engine for Object Pascal. Rendering and processing of game assets in glTF, X3D, VRML, Collada, Spine and other formats. Many graphic effects including shadows, shaders, mirrors, screen effects. Animation, collision detection, 3D sound. Extensible system of 3D objects, with out-of-the-box levels, items, intelligent creatures and more. Desktop, mobile, web plugin. Also home of view3dscene - our full-featured VRML/X3D browser.
Features
- Many 3D formats supported: glTF, X3D, VRML, Collada, MD3, 3DS, more
- 2D games development, with Spine 2D and sprite sheeet animations support
- Reading and writing of X3D, converting other 3D models to X3D
- Scalable user interface with anchors
- Modern OpenGL / OpenGLES 2.0 renderers using shaders and VBOs
- Shadows using shadow maps and shadow volumes
- Mirrors using cube environment mapping and other methods
- Scene manager, custom viewports
- Creatures (with AI), items, player, inventory working out of the box
- Bump mapping, with steep parallax bump mapping with self-shadowing
- Screen-space effects in GLSL
- Sound and music using OpenAL, for 3D and 2D games
- Portable (Windows, Linux, Mac OS X, mobile platforms: Android, iOS, consoles: Nintendo Switch)
- Build tool to easily package games for (e.g. produces ready Android apk from sources)
- Source code in clean ObjectPascal (for FreePascal)
- Includes Lazarus components for RAD development
Project Samples


License
GNU Library or Lesser General Public License version 2.0 (LGPLv2), GNU General Public License version 2.0 (GPLv2)Other Useful Business Software
AI-powered service management for IT and enterprise teams
Give your IT, operations, and business teams the ability to deliver exceptional services—without the complexity. Maximize operational efficiency with refreshingly simple, AI-powered Freshservice.
Rate This Project
Login To Rate This Project
User Reviews
-
There is no easier way to write your own games in Free Pascal.
-
Probably one of the best game engines for Free Pascal users.
-
Great engine for Lazarus!!!
-
Great pascal game engine!
-
pa pa pa i loving it. ok its not ogre or irrlith but its for pascal. and ist best for it.